What we do
Measure risk. Size exposure. Score the forecast.
We hold broad market exposure and decide how much of it to carry. We believe that decision is better made against the risk the options market is pricing today than against an average of what volatility happened to be last year.
Markets pay for risk. We hold it.
Over time, markets pay investors for carrying risk, and for most investors that payment is very nearly all of what they earn across a lifetime. Clever trades are not what builds the number at the end.
So we hold broad exposure to a diversified set of markets and seek to be paid for bearing it. We do not look for mispriced securities. We do not predict where markets go next.
How much to hold is the decision.
Every portfolio makes it, deliberately or by default: how much market risk to carry, and in what mix. It is the one decision that applies to every holding at once, it is made again every day whether or not anyone revisits it, and it is our work.
A boat carrying one large sail, set once and left alone, is at the mercy of whatever weather it meets. A boat with several sails, each of which can be trimmed, reefed and turned, works the same wind in far more conditions — and can make ground against the wind by tacking, which a fixed rig cannot do at all. The wind is not the variable. The rig is.
That is the difference we are after. A static allocation spreads risk across assets and then leaves the mix alone; it is diversified and it is fixed. We carry several exposures and keep adjusting how much of each we hold, against what the market is pricing now.
We have no motor. Nothing here manufactures a return the market is not offering — we are trying to catch more of the wind that is already blowing, not to do without it.
We read risk where it is priced.
We do not predict the weather. We read the barometer and set the sails.
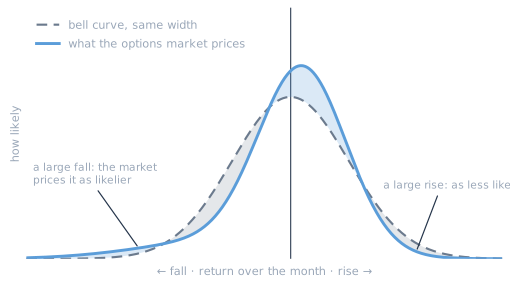
The conventional answer comes from a window of history: how rough the water was, on average, over some past period. That number updates slowly. It usually treats a crash as the mirror image of a rally. And it is least reliable exactly when conditions are changing.
We read the options market instead. Option prices are set continuously by participants with real capital at stake. Together they describe the whole range of outcomes the market currently expects for an asset — including how much heavier the downside is than the upside.
When that picture worsens, we carry less. When it clears, we carry more.
Assets move together differently in a storm.
We hold a diversified set of markets, so how they move together matters as much as how each one moves. Those relationships are not fixed. Assets that usually move apart can move together in a decline, which is when it costs the most.
So we forecast them, and update as conditions change, rather than taking one number from a lookback window and keeping it.
What we do not do.
We do not predict markets. We do not pick stocks. We do not hedge away market risk, and we do not promise absolute returns. Our strategy is exposed to markets by design. When markets decline, it should be expected to decline with them. Over shorter periods it may do worse than a simpler approach.
We write the forecast down. Then we score it.
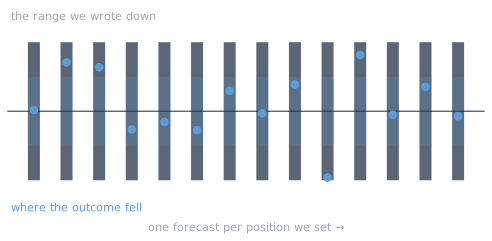
Each time we set positions, we record the full range of outcomes we expect, and when the result arrives we note where it fell inside that range. Do that enough times and a forecast has nowhere to hide: one that flatters itself shows up as surely as one that is right.
We think that is the honest thing to be judged on today. Judge us on returns over the long run, because nothing shortens how long a return record takes to mean anything.
The process, step by step.
Our Approach sets out how each stage works and what the strategy is not.
Institutional and qualified investors may request our methodological note at qualified_investments@objectivedynamix.com.